Our market update for the metro Denver area for October 2025 is broken down into All Residential, as well as Luxury Residential stats.
Below are links to download our update, as well as a breakdown of the stats in more detail:
- Metro Denver Area Residential Luxury Market Update
- Metro Denver Area Residential Market Update Detailed Stats
The Change of Seasons and the Natural Shift of the Real Estate Markets!
We have now completed 9 months of the year and enter the 4th Quarter with a change of color in the leaves as well as the Denver Real Estate Market! Just like the leaves changing color gradually, so does the market this time of year! We have the wonderful memories of all the Summer activities and vacations behind us, while we now have kids back in school and get back into our normal routines, disciplines and motivations! The 4th Quarter gives us all an opportunity to recalibrate and look at the opportunities in the
Denver Real Estate Market.
The Market continues to have a strong supply of homes available for Sale at over 13,000 Active Listings. New Listings, Pendings and Closed Sales have been fairly consistent in 2023, 2024 and 2025. The Average Prices for a Single Family home have held fairly steady this year at $768,507 in the month of September, however the days on the market have increased to 53 which is up over 32% from last year.
Sellers: Pricing Strategy is the most crucial part of the process in this market, and many have shifted to more thorough investigations on what is currently on the market and competing than what has Sold in the last six months.
Buyers: The Affordability stress has eased slightly in September as the Federal Funds Rate decreased and Mortgage rates have improved to the high 5% to low 6% range. The Combination of lower asking prices and lower interest rates gives you the best opportunities we’ve seen in this market this year! Don’t delay and take advantage of this change of Season!
We are always ready to discuss your Real Estate needs, and share our experience to help you make the best decisions right now!
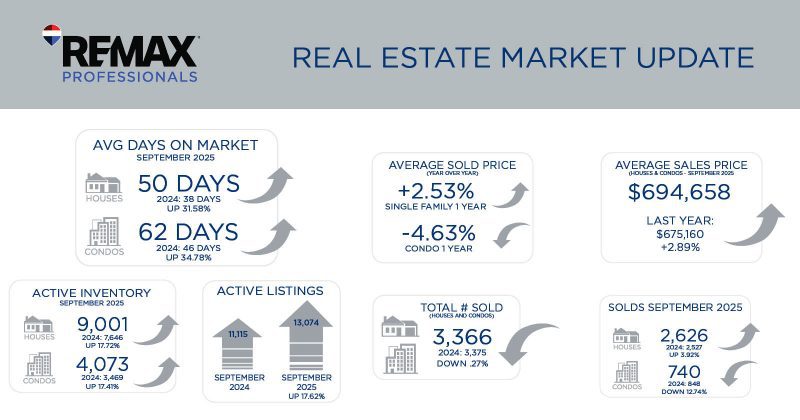
Metro Denver Area Residential Market Update
AVERAGE DAYS ON MARKET
SEPTEMBER 2025
 50 DAYS
 2024: 38 DAYS
UP 31.58%
2024: 38 DAYS
UP 31.58%
 62 DAYS
2024: 46 DAYS
UP 34.78%
62 DAYS
2024: 46 DAYS
UP 34.78%
ACTIVE INVENTORY
SEPTEMBER 2025
9,001
2024: 7,646
UP 17.72%
4,073
2024: 3,469
UP 17.41%
ACTIVE LISTINGS


11,115
13,074
SEPTEMBER 2024
SEPTEMBER 2025
UP 17.62%
UP 17.62%
AVERAGE SOLD PRICE
(YEAR OVER YEAR)
+2.53%
SINGLE FAMILY 1 YEAR
-4.63%
![]() CONDO 1 YEAR
CONDO 1 YEAR
SOLDS
SEPTEMBER 2025
2,626
2024: 2,527
UP 3.92%
740
![]() 2024: 848
DOWN 12.74%
2024: 848
DOWN 12.74%
TOTAL # SOLD (HOUSES & CONDOS – SEPTEMBER 2025) 3,366 LAST YEAR: 3,375 DOWN 0.27%
AVERAGE SALES PRICE (HOUSES & CONDOS – SEPTEMBER 2025) $694,658 LAST YEAR: $675,160 UP 2.89%
Metro Denver Area Luxury Market Update
The Change of Seasons and the Natural Shift of the Real Estate Markets!
Wow! Luxury buyers are out buying and seizing the opportunities of lower interest rates and increased inventory allowing for more choices and better negotiating ability. The overall number of homes sold this year in the luxury market has increased 4% over last year. For the year prices are holding steady – the properties selling at over list price are counter balancing the properties that are selling at below list price. Days on the market has increased to 56 which naturally is happening with the increasing amount of inventory.
The story of the luxury market remains the same, homes that are in good neighborhoods and in updated condition and priced well are selling at or near list and some times over list price. Homes that are tired and where buyers feel there are a lot of projects to tackle are suffering from longer days on the market and lower selling prices. Sellers make sure you are going to market at the right price and Buyers, make sure you are out taking advantage of the opportunities in this market!
AVERAGE DAYS ON MARKET
SEPTEMBER 2025
56 DAYS
2024: 43 DAYS
UP 30.23%
91 DAYS
![]() 2024: 114 DAYS
DOWN 20.18%
2024: 114 DAYS
DOWN 20.18%
NEW LISTINGS
SEPTEMBER 2025
696
2024: 633
UP 9.95%
51
![]() 2024: 54
DOWN 5.56%
2024: 54
DOWN 5.56%
TOTAL # SOLD (HOUSES & CONDOS – SEPTEMBER 2025) 404 LAST YEAR: 388 UP 4.12%
AVERAGE SALES PRICE (HOUSES & CONDOS – SEPTEMBER 2025) $1,639,244 LAST YEAR: $1,539,971 UP 6.45%
AVERAGE SOLD YTD
SEPTEMBER 2025
+0.26%
SINGLE FAMIlY 1 YEAR
-0.25%
![]() CONDO 1 YEAR
CONDO 1 YEAR
TOTAL SOLDS YTD
SEPTEMBER 2025
3,748
2024: 3,494
UP 7.27%
163
![]() 2024: 216
DOWN 24.54%
2024: 216
DOWN 24.54%