Our market update for the metro Denver area for September 2026 is broken down into All Residential, as well as Luxury Residential stats.
Below are links to download our update, as well as a breakdown of the stats in more detail:
- Metro Denver Area Residential Market Update
- Metro Denver Area Residential Luxury Market Update
- Metro Denver Area Residential Market Update Detailed Stats
Metro Denver Area Residential Market Update
The Fall Market is Beginning!
Summer is winding down, our kids are back in school, and the Labor Day weekend has come and gone, and many believe the Real Estate market is on the downhill path for the year! Something unexpected may be happening in the market as Buyers are returning and appropriately priced homes are seeing increased showing activity and more offers! Maybe some of that typical Spring momentum has shifted to the Fall Market?
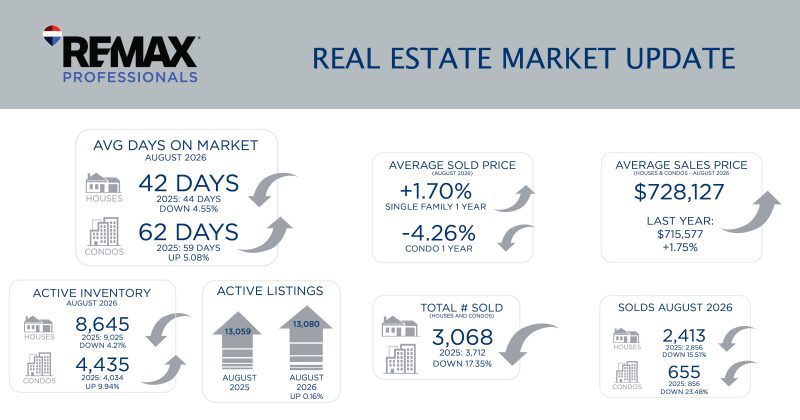
Almost every day we get asked is the Real Estate market good or bad, hot or cold, a buyer’s market or a seller’s market? This year that answer is Yes! We have three signals pointing us in three directions as Closed Sales in August were down 19 percent from last month and over 17 percent from August of last year. However, Inventory levels for Active Listings are just over 13,000 and that is almost identical to last month and last year and average prices remained almost flat as well! Looking closer at the detached and attached home markets separately, the two are moving in very different ways: Attached homes average days on market was at 62 days, over 5% higher than last year and the average price was down over 4% from last year. Detached homes average days on market was at 42 and that is down 4.5% from last year and average prices are up 1.7% from August 2026. A client selling a condo or townhome faces challenges that a single-family seller does not.
Our job as your REMAX Realtor is to understand your individual needs and give you our best advice and expertise on how to get the best value in this current market! Here is our first piece of advice: The Fall Market is typically the second busiest time of the year, and you have a fantastic window of opportunity between now and Thanksgiving to sell your home if needed or to buy at a great time.
AVERAGE DAYS ON MARKET
AUGUST 2026
 42 DAYS
 2025: 44 DAYS
DOWN 4.55%
2025: 44 DAYS
DOWN 4.55%
 62 DAYS
 2025: 59 DAYS
UP 5.08%
2025: 59 DAYS
UP 5.08%
ACTIVE INVENTORY
AUGUST 2026
8,645
2025: 9,025
DOWN 4.21%
4,435
2025: 4,034
UP 9.94%
ACTIVE LISTINGS


13,059
13,080
AUGUST 2025
AUGUST 2026
UP 0.16%
UP 0.16%
AVERAGE SOLD PRICE
(YEAR OVER YEAR)
+1.70%
SINGLE FAMILY 1 YEAR
-4.26%
CONDO 1 YEAR
SOLDS
AUGUST 2026
2,413
2025: 2,856
DOWN 15.51%
655
2025: 856
DOWN 23.48%
TOTAL # SOLD (HOUSES & CONDOS – AUGUST 2026) 3,068 LAST YEAR: 3,712 DOWN 17.35%
AVERAGE SALES PRICE (HOUSES & CONDOS – AUGUST 2026) $728,127 LAST YEAR: $715,557 UP 1.75%
Metro Denver Area Luxury Market Update
Denver’s luxury real estate market showed a mix of resilience and seasonal slowing in August. Average sales prices increased nearly 4.5%, even as the number of completed sales declined by just over 14%. Single-family luxury homes continued to outperform the attached market, averaging 47 days on the market, down slightly from a year ago.
Luxury condos, by comparison, averaged 99 days on the market, highlighting the very different dynamics buyers and sellers are experiencing depending on property type. The decline in August sales appears less like a change in the direction of the luxury market and more like a late-summer pause. Vacations, travel and families preparing for the new school year traditionally compete for buyers’ attention as summer winds down.
With Labor Day behind us, attention now turns to Denver’s fall selling season. Buyers remain selective, but they are still active, making thoughtful pricing, exceptional presentation and a strong marketing strategy especially important for sellers hoping to stand out as activity picks up this fall. August also helped out buyers by having more choices in the market as the number of active listings coming on the market increased.
AVERAGE DAYS ON MARKET
AUGUST 2026
47 DAYS
2025: 51 DAYS
DOWN 7.84%
99 DAYS
2025: 50 DAYS
UP 98%
NEW LISTINGS
AUGUST 2026
628
2025: 550
UP 14.18%
40
2025: 39
UP 2.56%
TOTAL # SOLD (HOUSES & CONDOS – AUGUST 2026) 458 LAST YEAR: 534 DOWN 14.23%
AVERAGE SALES PRICE (HOUSES & CONDOS – AUGUST 2025) $1,691,722 LAST YEAR: $1,618,971 UP 4.49%
AVERAGE SOLD YTD
AUGUST 2026
+1.25%
SINGLE FAMIlY 1 YEAR
-0.44%
CONDO 1 YEAR
TOTAL SOLDS YTD
AUGUST 2026
3,864
2025: 3,769
UP 2.52%
182
2025: 168
UP 8.33%