


Our market update for the metro Denver area for September 2024 is broken down into All Residential, as well as Luxury Residential stats.
Below are links to download our update, as well as a breakdown of the stats in more detail:
- Metro Denver Area Residential Market Update
- Metro Denver Area Residential Luxury Market Update
- Metro Denver Area Residential Market Update Detailed Stats
Metro Denver Area Residential Market Update
Is it Summer or is it Fall? Are Interest Rates going up or are they going down? We know one thing that is predictable, and that is the beautiful leaves changing right on schedule in our majestic Colorado Mountains!
The Real Estate market in the Denver Metro area is also fairly predictable in the fall market, as buyers tend to re-engage and take advantage of softer prices and lower interest rates. The fall market has also had some ups and downs as buyer demand has been up and down with concerns about affordability and possibly this election cycle!
This lack of activity has increased the active inventory to over 11,000 residential properties on the market currently and the months of Inventory now at 3.6 months compared to days of inventory during the pandemic. Homes are simply spending more time on the market and experiencing more price reductions before finding the right buyer.
Buyers are less willing to compromise on a home that needs work unless the value lines up with their expectations.
Sellers need to understand that it’s simply taking longer for homes to sell, and correct pricing and smart marketing will help sell their home as we get closer to the election and the holidays!
Buyers, if you are waiting for the election and holidays to wrap up, you may be kicking yourselves later, so get in this market now while the values are the best we have seen all year! Do it now!
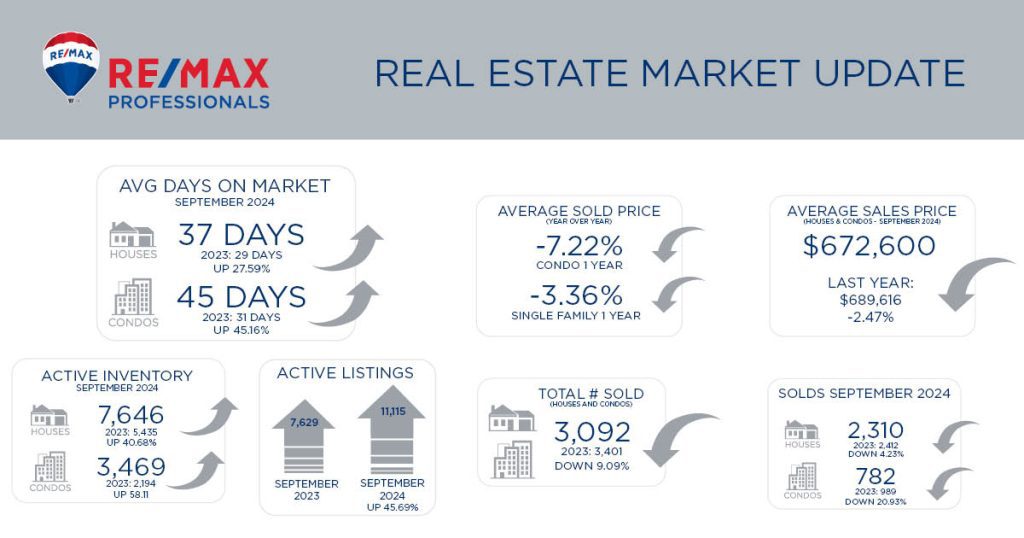
AVERAGE DAYS ON MARKET
SEPTEMBER 2024


ACTIVE INVENTORY
SEPTEMBER 2024
ACTIVE LISTINGS


7,629
11,115
SEPTEMBER 2023
SEPTEMBER 2024
UP 45.69%
UP 45.69%

AVERAGE SOLD PRICE
(YEAR OVER YEAR)
![]()
![]()
SOLDS
SEPTEMBER 2024
![]()
![]()
TOTAL # SOLD (HOUSES & CONDOS – SEPTEMBER 2024) 3,092 LAST YEAR: 3,401 DOWN 9.09%
AVERAGE SALES PRICE (HOUSES & CONDOS – SEPTEMBER 2024) $672,600 LAST YEAR: $689,616 DOWN 2.47%
Metro Denver Area Luxury Market Update
The Luxury market is very active right now with a nearly 14% increase in sales over this time last year, however buyers are being very picky. If the property isn’t perfect to meet their needs, they are moving onto the next property or waiting until what in their mind is the perfect property to come on the market.
What this translates into for sellers is that your property better be in great shape when it goes on the market, the old adage rings true, “you never have a second opportunity to make a first impression.” Presentation is critical, updates for current color trends is critical and pricing appropriately is critical. If you do all of these things then it is very likely that your property will sell within the first two weekends at very near or even possibly over your list price. If however you are missing one of the critical items of presentation, updates and appropriate pricing it is very likely that your property will be sitting on the market for approximately two months and you will likely experience the need to make a price reduction.
The great news for buyers is that the number of active listings is up 30% over last month so you have many more choices, prices overall have decreased approximately 8% from this time last year so if you are willing to make some updates on a property to fit your own personal needs you can likely get a very good deal on a new home right now, there are sellers who are wanting to sell in the 4th quarter. Now is the time to buy!
AVERAGE DAYS ON MARKET
SEPTEMBER 2024
NEW LISTINGS
SEPTEMBER 2024
![]()
TOTAL # SOLD (HOUSES & CONDOS – SEPTEMBER 2024) 359 LAST YEAR: 395 DOWN 9.11%
AVERAGE SALES PRICE (HOUSES & CONDOS – SEPTEMBER 2024) $1,511,530 LAST YEAR: $1,650,394 DOWN 8.40%
AVERAGE SOLD YTD
SEPTEMBER 2024
![]()
TOTAL SOLDS YTD
SEPTEMBER 2024
![]()