Our market update for the metro Denver area for May 2026 is broken down into All Residential, as well as Luxury Residential stats.
Below are links to download our update, as well as a breakdown of the stats in more detail:
- Metro Denver Area Residential Market Update
- Metro Denver Area Residential Luxury Market Update
- Metro Denver Area Residential Market Update Detailed Stats
Metro Denver Area Residential Market Update
Happy Groundhog Year!
The 2026 Denver Real Estate Market has become less seasonal with the Spring and Summer peaks and valleys. Actually, the Denver Metro Market is settling into something much more consistent and far less dramatic. We saw such an aggressive market from 2017 through the Pandemic boom with Median prices going from $473,000 in early 2021 to over $616,000 in April 2022. Now, it truly has felt like a slow and steady groundhog year again as the Median price has been nearly identical at $602,000 in April 2024, and $604,000 in April 2025 and we ended April 2026 at $605,000. General household needs are creating a much more consistent real estate market versus the human behavior of the Seasons. This also shows the resiliency of the market with the Global economic uncertainty and the rise in Mortgage rates this year! Supply and Demand continue to support the foundation as the Active Inventory rose substantially from last month to 11,539 up over 17%, while Pending’s and Closed homes stayed almost identical to the month before!
Sellers: we are seeing a clear pattern where homes that are prepared and show well and priced correctly will sell in the first 7-10 days, otherwise they tend to fall closer to the Average days on the market which is currently 40.
Buyers, you have a great supply of homes to preview and compare and finally a little time to think about your purchase, compare and negotiate. Prices are staying fairly consistent this year, but be careful not to rely on the wait and see approach too much as you see the next home for you, please make a decision quickly before you have to work with competing offers!
This market isn’t unpredictable like it seemed the past few years – it’s becoming reliable and steady! Right now, reliable and steady is a good place to be!
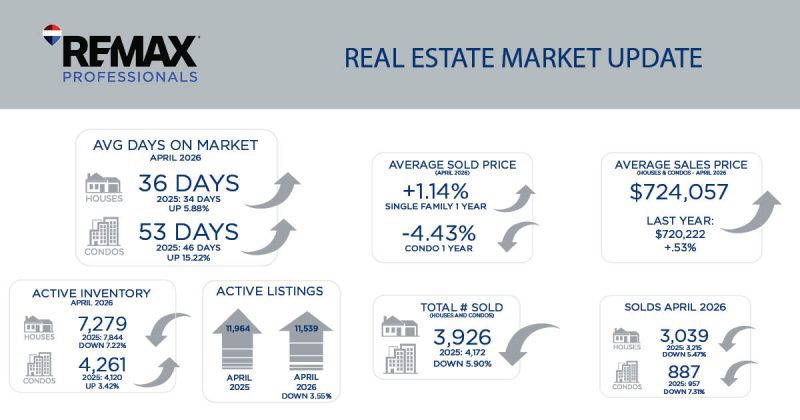
AVERAGE DAYS ON MARKET
APRIL 2026
 36 DAYS
 2025: 34 DAYS
UP 5.88%
2025: 34 DAYS
UP 5.88%
 53 DAYS
2025: 46 DAYS
UP 15.22%
53 DAYS
2025: 46 DAYS
UP 15.22%
ACTIVE INVENTORY
APRIL 2026
7,279
![]() 2025: 7,844
DOWN 7.22%
4,261
2025: 4,120
UP 3.42%
2025: 7,844
DOWN 7.22%
4,261
2025: 4,120
UP 3.42%
ACTIVE LISTINGS


11,964
11,539
APRIL 2025
APRIL 2026
DOWN 3.55%
DOWN 3.55%
AVERAGE SOLD PRICE
(YEAR OVER YEAR)
+1.14%
SINGLE FAMILY 1 YEAR
-4.43%
![]() CONDO 1 YEAR
CONDO 1 YEAR
SOLDS
APRIL 2026
3,039
![]() 2025: 3,215
DOWN 5.47%
887
2025: 3,215
DOWN 5.47%
887
![]() 2025: 957
DOWN 7.31%
2025: 957
DOWN 7.31%
TOTAL # SOLD (HOUSES & CONDOS – APRIL 2026) 3,926 LAST YEAR: 4,172 DOWN 5.90%
AVERAGE SALES PRICE (HOUSES & CONDOS – APRIL 2026) $724,057 LAST YEAR: $720,222 UP 0.53%
Metro Denver Area Luxury Market Update
Denver’s luxury real estate market is showing clear signs of stabilization, suggesting a healthier and more balanced environment for both buyers and sellers. While average days on market have ticked up slightly to 38, this modest shift points to a cooling from the frenetic pace of recent years rather than any loss of demand. Home prices continuing to rise—albeit at a more sustainable rate of just under 2% year over year—signal ongoing confidence in the high-end segment without the volatility of sharp spikes. At the same time, annual sales volume is essentially flat, down by less than 1%, and new listings have increased by only 1%, indicating that supply and demand are moving in near alignment.
For buyers, this means more breathing room to make thoughtful decisions without facing intense bidding wars, while still needing to act decisively on desirable properties.
For sellers, it reinforces the importance of strategic pricing and strong presentation, as homes are still selling but with a bit more scrutiny from discerning buyers. Overall, the market appears to be transitioning into a more predictable, sustainable phase. As always please consult your favorite RE/MAX Professionals agent as data for each neighborhood in Denver varies.
AVERAGE DAYS ON MARKET
APRIL 2026
38 DAYS
2025: 36 DAYS
UP 5.56%
29 DAYS
![]() 2025: 39 DAYS
DOWN 25.64%
2025: 39 DAYS
DOWN 25.64%
NEW LISTINGS
APRIL 2026
1,005
2025: 1,003
UP 0.20%
59
2025: 51
UP 15.69%
TOTAL # SOLD (HOUSES & CONDOS – APRIL 2026) 557 LAST YEAR: 596 DOWN 6.54%
AVERAGE SALES PRICE (HOUSES & CONDOS – APRIL 2025) $1,629,892 LAST YEAR: $1,602,101 UP 1.73%
AVERAGE SOLD YTD
APRIL 2026
-0.60%
![]() SINGLE FAMIlY 1 YEAR
SINGLE FAMIlY 1 YEAR
-4.24%
![]() CONDO 1 YEAR
CONDO 1 YEAR
TOTAL SOLDS YTD
APRIL 2026
537
![]() 2025: 569
DOWN 5.62%
20
2025: 569
DOWN 5.62%
20
![]() 2025: 27
DOWN 25.93%
2025: 27
DOWN 25.93%