Our market update for the metro Denver area for March 2024 is broken down into All Residential, as well as Luxury Residential stats.
Below are links to download our update, as well as a breakdown of the stats in more detail:
- Metro Denver Area Residential Market Update
- Metro Denver Area Residential Luxury Market Update
- Metro Denver Area Residential Market Update Detailed Stats
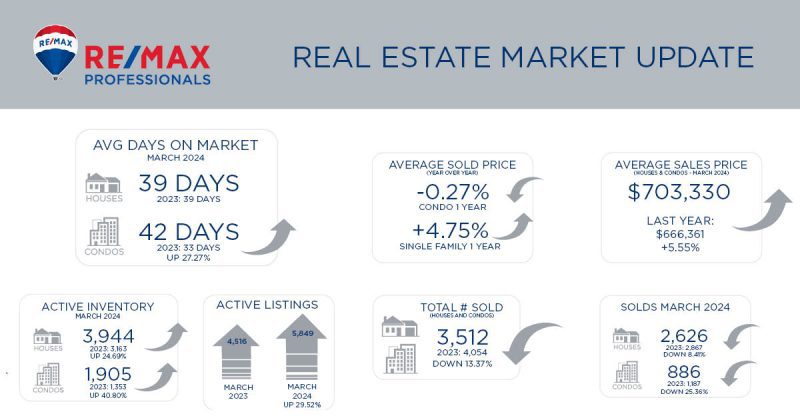
Metro Denver Area Residential Market Update
The Residential Housing market is getting back on track after a sluggish start to the year over the Winter months, with an economy that is showing some resilience in the job market and consumer spending which continues to maintain a stubborn inflation.
This data is also delaying any adjustments from the Federal Reserve and keeping interest rates higher than we all want to see. Sellers are beginning to trust that rates will eventually come down and starting to look at new homes and put their homes on the market and increasing Inventory.
Positive trends are showing as we look at the Market by the numbers:
- Active Listings are over 5,800 which is 30% higher than last year!
- Pending homes in March were over 4,300 and that is 7.5% higher than March of 2023!
- Closings in March were just over 3,500 and that is actually down 13% from a year ago. Closings are always a lagging indicator, so with the increased Inventory and Pendings, we should see some positive Closing numbers over the next few months.
- Most notably are the average price increases both month over month and year over year at 4% and 5.55% respectively. This is a much more normal rate of appreciation versus the consistent double digit increases over many years in the last decade.
There are so many positive factors this time of year for both Buyers and Sellers, so now is the time to Spring into action if you need to sell or find the home of your dreams! Thank you for trusting our many years of experience and knowledge of the Real Estate market! We look forward to discussing your housing needs very soon!
AVERAGE DAYS ON MARKET
MARCH 2024
 39 DAYS
 2023: 39 DAYS
–
2023: 39 DAYS
–
 42 DAYS
 2023: 33 DAYS
UP 27.27%
2023: 33 DAYS
UP 27.27%
ACTIVE INVENTORY
MARCH 2024
3,944
2023: 3,163
UP 24.69%
1,905
2023: 1,353
UP 40.80%
ACTIVE LISTINGS


4,516
5,849
MARCH 2023
MARCH 2024
UP 29.52%
UP 29.52%
AVERAGE SOLD PRICE
(YEAR OVER YEAR)
+4.75%
SINGLE FAMILY 1 YEAR
-0.27%
![]() CONDO 1 YEAR
CONDO 1 YEAR
SOLDS
MARCH 2024
2,626
![]() 2023: 2,867
DOWN 8.41%
886
2023: 2,867
DOWN 8.41%
886
![]() 2023: 1,187
DOWN 25.36%
2023: 1,187
DOWN 25.36%
TOTAL # SOLD (HOUSES & CONDOS – MARCH 2024) 3,512 LAST YEAR: 4,054 DOWN 13.37%
AVERAGE SALES PRICE (HOUSES & CONDOS – MARCH 2024) $703,330 LAST YEAR: $666,361 UP 5.55%
Metro Denver Area Luxury Market Update
The luxury market is in a state of transition right now. Average days on the market are increasing and prices are flattening but the number of purchases is increasing as this level of buyer is seeing opportunities in the market.
Between $1M and $2M inventory is relatively low with supply hovering around 2 months supply. As you move into the $2M to $3M price range inventory increases to a 4 month supply and as you move to the $3M to $5M range supply increases to 5-7 months pointing out just how critical correct pricing is.
Average days on the market for the $1M to $2M price range is approximately 42 days, as you go to the $2M to $3M price range average days on the market increase to 58 and above $3M the days on the market really increases to over 100 days.
This being said nearly 45% of homes priced between $1M and $2M are selling in the first 7 days, between $2M and $3M – 40% are selling in 7 days and $3M to $4M – 30% are selling in 7 days pointing to the fact that there are a lot of luxury buyers waiting for the right home to come on the market in their desired neighborhood.
For Sellers these numbers point out that pricing is critical and for Buyers, there are opportunities for you if you are willing to consider a house that is not “perfect” but could be perfect with your personal touches.
AVERAGE DAYS ON MARKET
MARCH 2024
46 DAYS
2023: 35 DAYS
UP 31.43%
62 DAYS
2023: 28 DAYS
UP 121.43%
NEW LISTINGS
MARCH 2024
678
2023: 616
UP 10.06%
44
![]() 2023: 68
DOWN 35.29%
2023: 68
DOWN 35.29%
TOTAL # SOLD (HOUSES & CONDOS – MARCH 2024) 442 LAST YEAR: 418 UP 5.74%
AVERAGE SALES PRICE (HOUSES & CONDOS – MARCH 2024) $1,600,870 LAST YEAR: $1,615,061 DOWN 0.88%
AVERAGE SOLD YTD
MARCH 2024
-3.6%
![]() SINGLE FAMIlY 1 YEAR
SINGLE FAMIlY 1 YEAR
+4.2%
CONDO 1 YEAR
TOTAL SOLDS YTD
MARCH 2024
407
2023: 371
UP 9.70%
35
![]() 2023: 47
DOWN 25.53%
2023: 47
DOWN 25.53%