


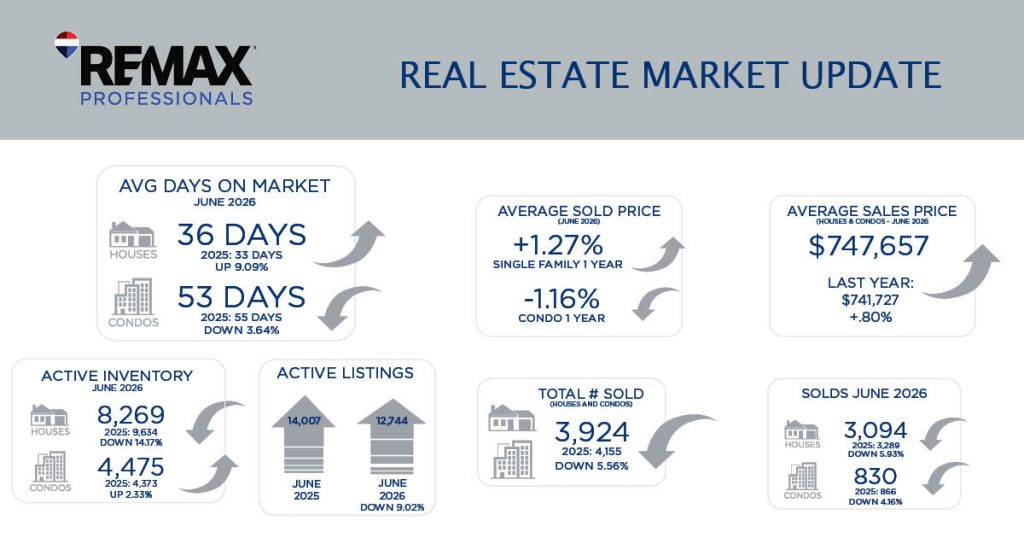
Our market update for the metro Denver area for July 2026 is broken down into All Residential, as well as Luxury Residential stats.
Below are links to download our update, as well as a breakdown of the stats in more detail:
- Metro Denver Area Residential Market Update
- Metro Denver Area Residential Luxury Market Update
- Metro Denver Area Residential Market Update Detailed Stats
Metro Denver Area Residential Market Update
Mid-Year Market Review!
We have just stepped over the half year threshold for 2026, with the first six months of the Denver Real Estate Market showing some unique characteristics while also showing some consistency from the last four years. Let’s look at the Mid-Year Numbers for the Denver Metro Market for the first six months: Active Listings at the end of June were 12,744 and that is down 9% from 2025. New Listings this year are at 33,837 and that is down over 5% from 2025. Sold and Closed Homes for the first six months are just over 21,000 and that is almost identical to the first six months of 2025, 2024, 2023 and 2022! Wow! The Average price of a Single Family Home year to date is just over $796,000 and that is almost identical to 2025. The Average Price of an Attached home is almost $440,000 and that is down almost 1% from last year. Lastly, the Average days on Market for all Residential homes is at 47 days and that is over 9% higher than last year.
Let’s take a sharper look at what’s happening with Buyers and Sellers in the market! Sellers: Be prepared for reduced showing activity in today’s market. The Denver Metro listings averaged 14.2 showings per month in May 2021, and by May 2026 that number has dropped to just 4.7, with showing activity declining by nearly two-thirds in just five years. The Market is almost infatuated with Move-in-Ready properties and not just cosmetic conditions. Buyers are walking into homes looking at the window sills, checking the age of the water heater and asking pointed questions about the furnace and roof. The condition of the home has quickly become the currency that matters most and is reshaping how both buyers and sellers think about value.
Buyers: The Inventory is fairly abundant in most parts of the city, and give you many options and choices. Please get prepared with your financing and don’t allow yourself to get too picky as the good homes are still flying off the shelf. This second half of the year may be your best opportunity to get great value for your dream home.
AVERAGE DAYS ON MARKET
JUNE 2026






ACTIVE INVENTORY
JUNE 2026
ACTIVE LISTINGS


14,007
12,744
JUNE 2025
JUNE 2026
DOWN 9.02%
DOWN 9.02%

AVERAGE SOLD PRICE
(YEAR OVER YEAR)
SOLDS
JUNE 2026
TOTAL # SOLD (HOUSES & CONDOS – JUNE 2026) 3,924 LAST YEAR: 4,155 DOWN 5.56%
AVERAGE SALES PRICE (HOUSES & CONDOS – JUNE 2026) $747,657 LAST YEAR: $741,727 UP 0.80%
Metro Denver Area Luxury Market Update
As of June 2026, Denver’s luxury residential real estate market continues to demonstrate remarkable resilience, even as the broader housing market becomes more balanced. High-end properties in the most desirable neighborhoods remain in strong demand among affluent local, relocation, and lifestyle buyers seeking exceptional quality, privacy, and modern amenities.
While inventory has improved compared to the historically constrained conditions of recent years giving buyers more choices, well-priced luxury homes continue to attract significant interest, especially those offering turnkey finishes, outdoor living spaces, and distinctive architectural design. Buyers are more discerning than during the pandemic-driven boom, resulting in longer marketing times for overpriced properties, yet premium homes that align with current market expectations on pricing continue to command strong values.
Overall, the June 2026 luxury market reflects a healthy transition toward greater equilibrium, providing buyers with more selection while rewarding sellers who price strategically and present their properties to the highest standard.
AVERAGE DAYS ON MARKET
JUNE 2026
NEW LISTINGS
JUNE 2026
TOTAL # SOLD (HOUSES & CONDOS – JUNE 2026) 604 LAST YEAR: 613 DOWN 1.47%
AVERAGE SALES PRICE (HOUSES & CONDOS – JUNE 2025) $1,685,752 LAST YEAR: $1,675,343 UP 0.62%
AVERAGE SOLD YTD
JUNE 2026
TOTAL SOLDS YTD
JUNE 2026