Our market update for the metro Denver area for December 2025 is broken down into All Residential, as well as Luxury Residential stats.
Below are links to download our update, as well as a breakdown of the stats in more detail:
- Metro Denver Area Residential Market Update
- Metro Denver Area Residential Luxury Market Update
- Metro Denver Area Residential Market Update Detailed Stats
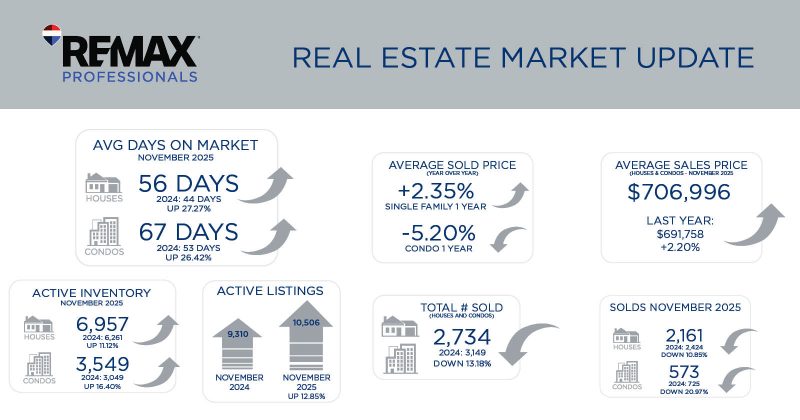
Metro Denver Area Residential Market Update
Seasonal Patterns of the Market this Holiday Season!
As we enter the December market and close out this year, we are looking in the mirror to see what
was perception and what is reality for the 2025 Denver Metro Real Estate Market!
The common narrative is that Sellers engaged in the market again with the Active Listing Inventory exceeding 14,000 plus, which is higher than we have seen since about 2012, and that Buyers hit pause and stepped back from purchasing this year! Reality is that the 2025 market looked incredibly similar
to 2023 and 2024 with a small 7% bump in New Listings, and the number of Sold homes year to date is almost identical to 2024!
The December and January markets are expected to continue the seasonal patterns of reduced inventory, fewer transactions and the typical Holiday slow down. We are seeing some Sellers coming off the market preparing to go active again early 2026. There are many who are waiting for extremes in the market, whether it’s a crash or a boom, and reality is the 2025 market needed to recalibrate and return to some normalcy similar to what we saw in 2019 and pre-pandemic times. This actually looked more like a typical real estate market that functioned with negotiation, reasonable time on the market and modest price adjustments. Buyers asking to negotiate concessions aren’t exploiting a weakness, but participating in a normal real estate transaction again.
Opportunity is in abundance for Buyers and Sellers as we head into 2026 as long as you embrace a
balanced and normal real estate market, so don’t wait on the sidelines waiting for extremes as we
enter a more stable and predictable time in the market!
Most importantly, enjoy a very Merry Christmas and Holiday Season and get ready for a prosperous New Year!
AVERAGE DAYS ON MARKET
NOVEMBER 2025
 56 DAYS
 2024: 44 DAYS
UP 27.27%
2024: 44 DAYS
UP 27.27%
 67 DAYS
2024: 53 DAYS
UP 26.42%
67 DAYS
2024: 53 DAYS
UP 26.42%
ACTIVE INVENTORY
NOVEMBER 2025
6,957
2024: 6,261
UP 11.12%
3,549
2024: 3,049
UP 16.40%
ACTIVE LISTINGS


9,310
10,506
NOVEMBER 2024
NOVEMBER 2025
UP 12.85%
UP 12.85%
AVERAGE SOLD PRICE
(YEAR OVER YEAR)
+2.35%
SINGLE FAMILY 1 YEAR
-5.20%
![]() CONDO 1 YEAR
CONDO 1 YEAR
SOLDS
NOVEMBER 2025
2,161
![]() 2024: 2,424
DOWN 10.85%
573
2024: 2,424
DOWN 10.85%
573
![]() 2024: 725
DOWN 20.97%
2024: 725
DOWN 20.97%
TOTAL # SOLD (HOUSES & CONDOS – NOVEMBER 2025) 2,734 LAST YEAR: 3,149 DOWN 13.18%
AVERAGE SALES PRICE (HOUSES & CONDOS – NOVEMBER 2025) $706,996 LAST YEAR: $691,758 UP 2.20%
Metro Denver Area Luxury Market Update
Denver’s luxury home market is showing a vibrant mix of stability and opportunity: despite homes spending an average of 63 days on the market—an 18% increase from this time last year—prices remain strong, with the average sales price up 3.67%. While November saw a slight 2% dip in sales, overall year-
to-date sales are still up an impressive 7.5%, signaling steady demand and solid buyer confidence.
For sellers, the increased market time means strategic presentation is essential: premium staging, sharp pricing, and standout marketing can help your property rise above the competition and capture motivated buyers who are still active and ready to pay for quality.
For buyers, the longer days on market create breathing room to compare options, negotiate more effectively, and secure a luxury property before prices climb further—an appealing window while overall demand remains strong. This moment offers both sides a chance to move confidently and advantageously in Denver’s evolving high-end market.
AVERAGE DAYS ON MARKET
NOVEMBER 2025
63 DAYS
2024: 53 DAYS
UP 18.87%
51 DAYS
![]() 2024: 109 DAYS
DOWN 53.21%
2024: 109 DAYS
DOWN 53.21%
NEW LISTINGS
NOVEMBER 2025
268
2024: 254
UP 5.51%
20
![]() 2024: 25
DOWN 20.00%
2024: 25
DOWN 20.00%
TOTAL # SOLD (HOUSES & CONDOS – NOVEMBER 2025) 356 LAST YEAR: 364 DOWN 2.20%
AVERAGE SALES PRICE (HOUSES & CONDOS – NOVEMBER 2025) $1,678,315 LAST YEAR: $1,618,838 UP 3.67%
AVERAGE SOLD YTD
NOVEMBER 2025
+1.36%
SINGLE FAMIlY 1 YEAR
-0.56%
![]() CONDO 1 YEAR
CONDO 1 YEAR
TOTAL SOLDS YTD
NOVEMBER 2025
4,988
2024: 4,638
UP 7.55%
231
![]() 2024: 282
DOWN 18.09%
2024: 282
DOWN 18.09%