Our market update for the metro Denver area for February 2026 is broken down into All Residential, as well as Luxury Residential stats.
Below are links to download our update, as well as a breakdown of the stats in more detail:
- Metro Denver Area Residential Market Update
- Metro Denver Area Residential Luxury Market Update
- Metro Denver Area Residential Market Update Detailed Stats
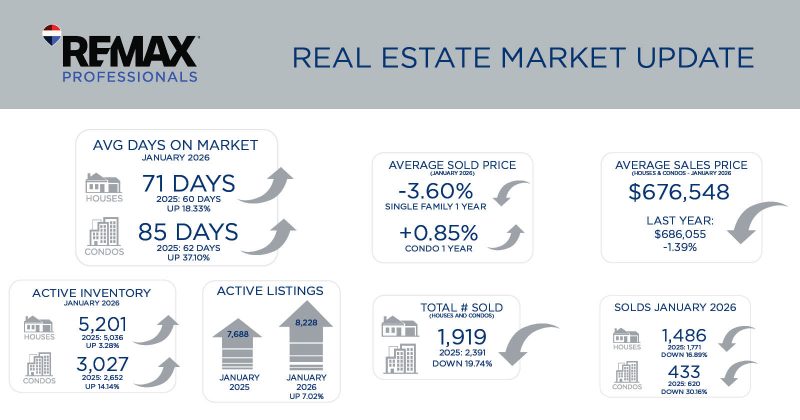
Metro Denver Area Residential Market Update
A warmer than usual January has just past as we experience a Winter of 60 Degree days, and you would expect that the Denver Real Estate Market would warm up quickly as well! Unfortunately, this has not been the case in January as our numbers are showing a much slower pace than expected. We all have high expectations for this 2026 Real Estate Market after the last three years of frustratingly flat performance. Our optimism may have exceeded the market performance so far, however one month does not make an entire market for the year!
Here are the concerning numbers for January 2026! Bad News First: The Denver Market closed only 1,919 homes in January, and that isn’t too surprising since the December buyer market paused and reevaluated their plans and expectations. This is the lowest number of Sold homes in Denver Metro since 2008, and the only time we were below 2,000 homes sold was in January 2010 and January 2011, both post-financial crisis years! Second: The average price of a Single Family home in January was down 3.6% and attached homes were mostly flat compared to January 2025. Third: The Average Days on market was up substantially to 74 vs 60 this time last year and that is up 23%. Now for some Good News: Active Listings were up to 8,228 and that is an increase of 7% from last year and 8% from last month. Historically, Active Listings go down from December to January, so it looks like we will see some good inventory to choose from this year. Also, Pendings were up 8.5% from January of 2025 so we are seeing some silver linings in this data!
Denver is an expensive place to live, so Sellers please adjust to longer days on the market and please, please, please do what it takes to make your home show well compared to other homes on the market! We can help you with this process, and we are really good at this and we have partners that can help you with the finances of cosmetic updates! Getting Full Price with occasional multiple offers is possible with the right preparation and advice!
Buyers today are prioritizing affordability and practicality, so please move quickly if you find the right home for you and take advantage of some good values in this market! We do not expect extremes in this year’s market, but do expect that the market will gradually improve throughout the year!
Lastly, the Super Bowl is behind us so it is time for our prime Spring Selling Season!
Make it a great February!
AVERAGE DAYS ON MARKET
JANUARY 2026
 71 DAYS
 2025: 60 DAYS
UP 18.33%
2025: 60 DAYS
UP 18.33%
 85 DAYS
2025: 62 DAYS
UP 37.10%
85 DAYS
2025: 62 DAYS
UP 37.10%
ACTIVE INVENTORY
JANUARY 2026
5,201
2025: 5,036
UP 3.28%
3,027
2025: 2,652
UP 14.14%
ACTIVE LISTINGS


7,688
8,228
JANUARY 2025
JANUARY 2026
UP 7.02%
UP 7.02%
AVERAGE SOLD PRICE
(YEAR OVER YEAR)
-3.60%
![]() SINGLE FAMILY 1 YEAR
SINGLE FAMILY 1 YEAR
+0.85%
CONDO 1 YEAR
SOLDS
JANUARY 2026
1,486
![]() 2025: 1,771
DOWN 16.89%
433
2025: 1,771
DOWN 16.89%
433
![]() 2025: 620
DOWN 30.16%
2025: 620
DOWN 30.16%
TOTAL # SOLD (HOUSES & CONDOS – JANUARY 2026) 1,919 LAST YEAR: 2,391 DOWN 19.74%
AVERAGE SALES PRICE (HOUSES & CONDOS – JANUARY 2026) $676,548 LAST YEAR: $686,055 DOWN 1.39%
Metro Denver Area Luxury Market Update
The numbers for the Luxury Market for January are a little bit flat due to the fact that these numbers actually represent activity that for the most part was December 2025 activity which would have been a month with traditionally slower activity and possibly some year end bargains from Sellers needing to sell. Also, remember that 2025 was a huge year for the luxury market, so keeping that pace ongoing may be too much for us to expect. The total number of sold homes in January was down 11% and overall prices were down 5%. Days on the market increased from an average of 77 to 93 days. While all of these numbers indicate a market favoring buyers at this time keep in mind that we are still seeing luxury homes selling in the first few days on the market with many receiving multiple offers and in some cases sold prices exceeding list price. So, don’t read too much into these numbers for January, the reality is that good homes priced correctly and in desirable neighborhoods are moving quickly.
There are however opportunities for Buyers who are willing to put in some effort on a home to get a great value on a home that has been sitting on the market for awhile. The luxury market is still one of the hottest parts of the metro Denver market.
Consult your favorite RE/MAX Professionals agent for specifics on your particular neighborhood!
AVERAGE DAYS ON MARKET
JANUARY 2026
93 DAYS
2025: 77 DAYS
UP 20.78%
154 DAYS
2025: 25 DAYS
UP 516.00%
NEW LISTINGS
JANUARY 2026
594
2025: 527
UP 12.71%
41
2025: 40
UP 2.50%
TOTAL # SOLD (HOUSES & CONDOS – JANUARY 2026) 238 LAST YEAR: 269 DOWN 11.52%
AVERAGE SALES PRICE (HOUSES & CONDOS – JANUARY 2025) $1,600,993 LAST YEAR: $1,688,597 DOWN 5.19%
AVERAGE SOLD YTD
JANUARY 2026
-6.04%
![]() SINGLE FAMIlY 1 YEAR
SINGLE FAMIlY 1 YEAR
+10.77%
CONDO 1 YEAR
TOTAL SOLDS YTD
JANUARY 2026
226
![]() 2025: 256
DOWN 11.72%
12
2025: 256
DOWN 11.72%
12
![]() 2025: 13
DOWN 7.69%
2025: 13
DOWN 7.69%