


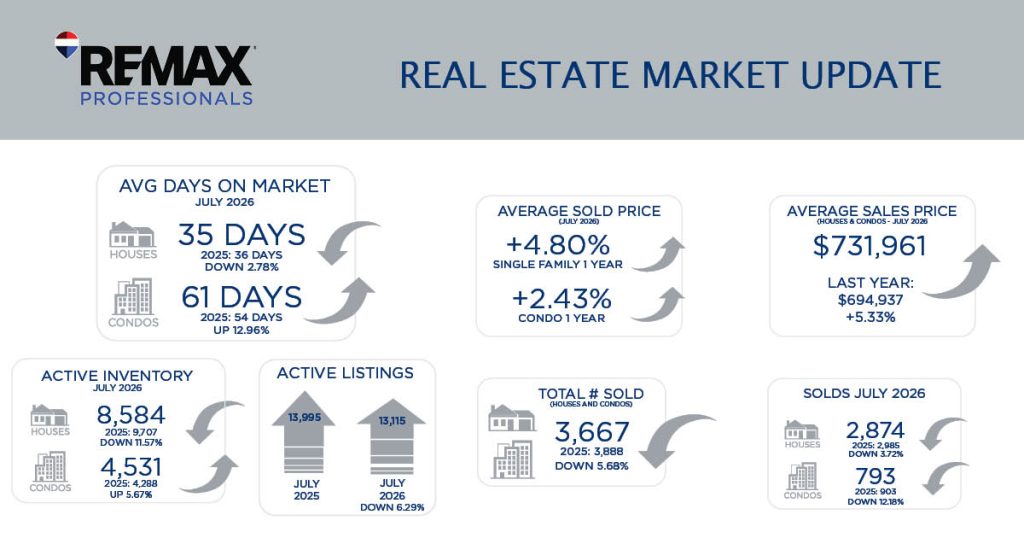
Our market update for the metro Denver area for August 2026 is broken down into All Residential, as well as Luxury Residential stats.
Below are links to download our update, as well as a breakdown of the stats in more detail:
- Metro Denver Area Residential Market Update
- Metro Denver Area Residential Luxury Market Update
- Metro Denver Area Residential Market Update Detailed Stats
Metro Denver Area Residential Market Update
As we look at the numbers for the Denver Metro Real Estate Market through the end of July there are two glaring statistics that stand out! First, new listings year to date are down almost 5% and the number of homes Sold year to date are down just over 2% and that is after the lackluster numbers for the last three years! Why are we in the Top 5? Real Estate is hyperlocal, and in a growing number of markets, buyers are gaining leverage as sellers compete harder to sell and close a home. Homesellers in Austin, San Antonio, Tampa, Dallas and Denver at #5 are cutting prices more aggressively than sellers in other major U.S. housing markets. According to real-time listing data from Parcl Labs, the Denver market listings with a price cut was at 50.9% of the market and the median price cut was 4.4% and almost 15% of the market is listed below their prior purchase price. The Price Change from the June 2022 peak is down 14.1%!
Across the Denver Metro market in July, homes that never needed a price cut sold in 6 days at 99.6% of the asking price. Sellers who had to cut their price took 54 days to sell and settled for 92.8% of the original asking price! 62.8% of closings had a seller concession where the seller helped pay for buyers closing costs. Roughly 1 in 5 contracts terminated before getting to the closing table!
Sellers these numbers are screaming how important it is to price your home correctly when you first come on the market! Buyers, the best houses are selling quickly but if you are looking for a good deal you may want to re-look at those homes that have been listed for a while.
There is opportunity for all participants in this market, and the Fall Market is coming up quickly!
Enjoy the end of Summer!
AVERAGE DAYS ON MARKET
JULY 2026






ACTIVE INVENTORY
JULY 2026
ACTIVE LISTINGS


13,395
13,115
JULY 2025
JULY 2026
DOWN 6.29%
DOWN 6.29%

AVERAGE SOLD PRICE
(YEAR OVER YEAR)
SOLDS
JULY 2026
TOTAL # SOLD (HOUSES & CONDOS – JULY 2026) 3,667 LAST YEAR: 3,888 DOWN 5.68%
AVERAGE SALES PRICE (HOUSES & CONDOS – JULY 2026) $731,961 LAST YEAR: $694,937 UP 5.33%
Metro Denver Area Luxury Market Update
The overall Denver market has settled into a more balanced environment, with buyers having more choices, negotiating power remaining elevated, and home-price appreciation staying relatively modest. In fact, recent Denver Metro Association of Realtors data describes the broader market as being in a state of equilibrium, with inventory near decade highs and buyers becoming increasingly selective.
But the luxury market is telling a very different story. For homes at the higher end of the market, demand has strengthened significantly. As of August 2026, Denver’s luxury segment is showing several encouraging trends:
- Average days on market: 38 days — down
- Average sales price: up 6.87%
- Homes sold: up 6.94%
- New listings: up 6.35%
That combination is important. More luxury homes are coming to market, more are selling, prices are increasing, and homes are selling faster.
So, what is driving the divergence?
- Luxury buyers are less dependent on mortgage rates.
- Wealth is increasingly concentrated at the top end of the market.
- Scarcity still matters, especially for exceptional properties.
- Today’s luxury buyer is selective, but ready to make a decision now.
What does this mean for Sellers – pricing, presentation, condition, marketing and condition matter more than ever. What does this mean for Buyers – Buyers have more choices to find the perfect property.
AVERAGE DAYS ON MARKET
JULY 2026
NEW LISTINGS
JULY 2026
TOTAL # SOLD (HOUSES & CONDOS – JULY 2026) 555 LAST YEAR: 519 UP 6.94%
AVERAGE SALES PRICE (HOUSES & CONDOS – JULy 2025) $1,651,945 LAST YEAR: $1,545,755 UP 6.87%
AVERAGE SOLD YTD
JULY 2026
TOTAL SOLDS YTD
JULY 2026